
Digital Signage ROI Calculator: Is Digital Signage Worth the Investment for Retail?
(Friendly reminder: An interactive ROI calculator simulator is available at the end of the article.)
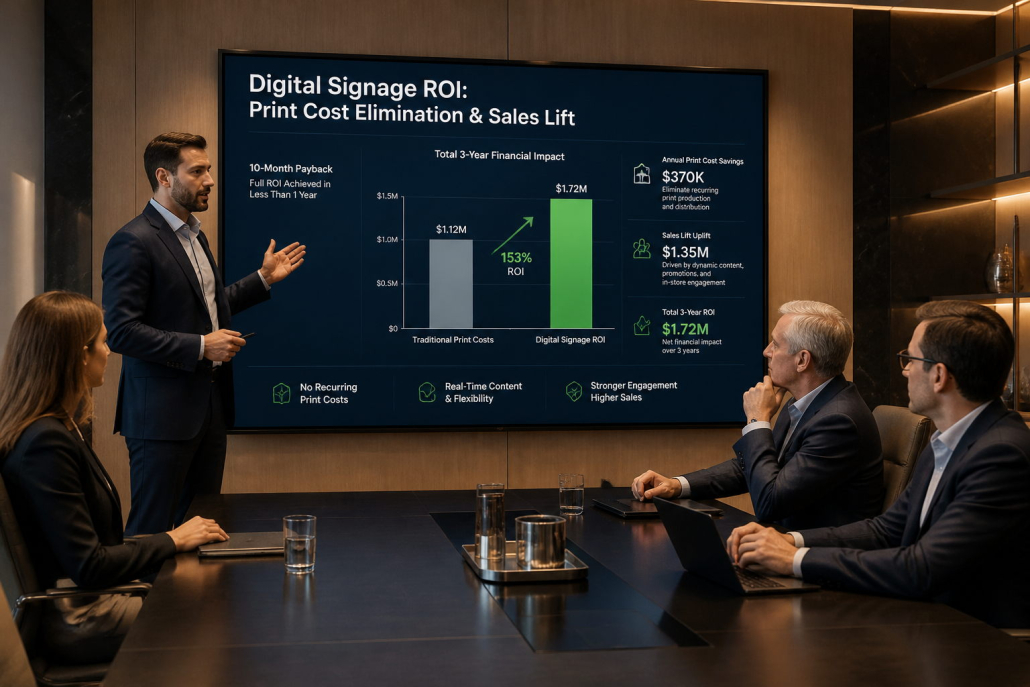
For retail businesses, every investment needs to demonstrate measurable value. Whether a company is opening new stores, upgrading its in-store advertising, or standardizing displays across multiple locations, management teams want to know one thing:
Will digital signage generate enough financial value to justify the investment?
Digital signage is more than a modern alternative to printed posters. It can help retailers reduce recurring printing and installation expenses, update promotional content faster, improve product visibility, and create more opportunities to influence purchasing decisions.
However, the actual return on investment (ROI) depends on several factors, including the number of stores, display quantity, existing printing costs, content update frequency, screen operating expenses, and the sales impact of digital promotions.
In this guide, we introduce a practical digital signage ROI calculator approach to help retail buyers estimate cost savings, evaluate potential sales growth, calculate the payback period, and present a more convincing investment proposal to company management.
1. Is Digital Signage Worth the Investment for Retail?
For many retailers, digital signage can be a worthwhile investment when it replaces recurring manual processes, supports more effective promotions, or improves the use of in-store advertising space.
Traditional printed signage has several limitations:
- Every promotional campaign may require new printing.
- Posters and promotional materials need to be shipped to individual stores.
- Store employees must spend time replacing outdated materials.
- Last-minute price changes and promotional adjustments can be difficult to implement.
- Printed materials may become outdated, damaged, or unusable.
- Different stores may display inconsistent promotional information.
Digital signage changes this process.
With a centralized content management system (CMS), retailers can update promotional content remotely, schedule campaigns in advance, and manage displays across multiple locations.
A single digital screen can also display multiple campaigns throughout the day, rather than being limited to one printed poster.
For retailers with frequent promotions, multiple locations, or high volumes of printed advertising materials, these advantages can create measurable operational savings.
However, digital signage is not automatically more cost-effective for every store. Businesses with very few promotional updates or low advertising requirements should compare the full lifecycle cost before investing.
2. Where Does the Financial Return of Digital Signage Come From?
When evaluating retail digital signage ROI, it is important to separate financial returns into two categories:
- Direct cost savings
- Additional revenue opportunities
 A. Reduce Printing and Promotional Material Costs
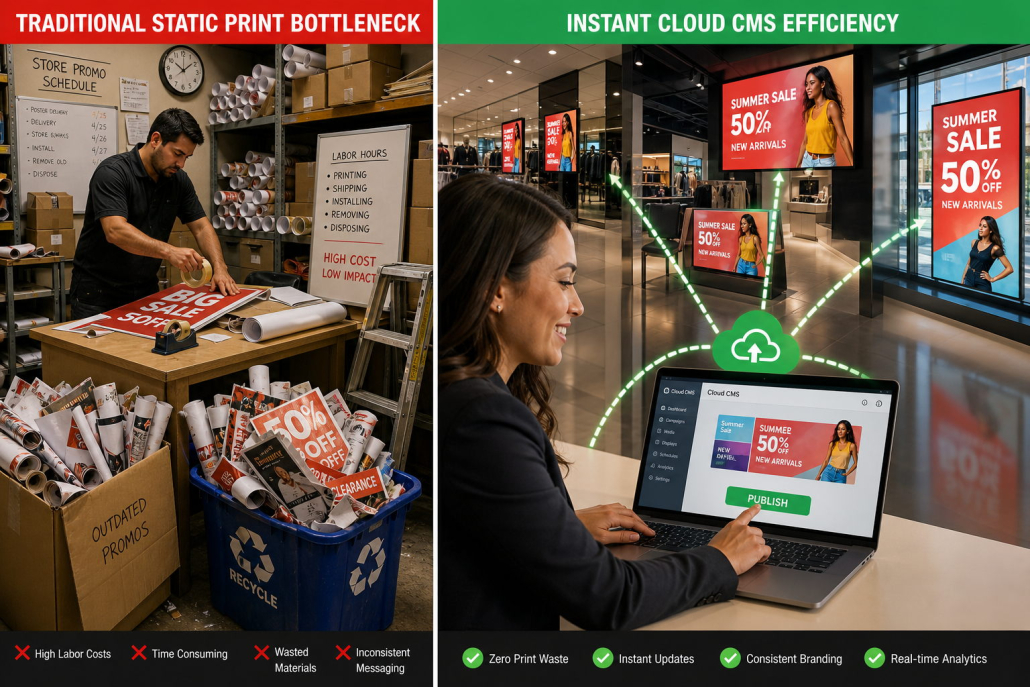 A. Reduce Printing and Promotional Material Costs
This is often the easiest financial benefit to measure.
Traditional retail advertising may involve recurring expenses for:
- Poster and banner printing
- Promotional price tags and signage
- Seasonal campaign materials
- Packaging and finishing
- Delivery to individual stores
- Replacement of outdated or damaged materials
Digital signage can reduce many of these recurring expenses by allowing retailers to distribute promotional content electronically.
Instead of printing hundreds of posters for every campaign, marketing teams can upload one digital creative file and distribute it to multiple screens.
The actual savings depend on the percentage of printed materials replaced by digital content.
B. Reduce Shipping, Installation, and Labor Costs
For a retail chain with multiple stores, distributing printed advertising materials can involve significant coordination.
Employees or external contractors may need to:
- Receive and organize promotional materials
- Remove old posters
- Install new displays
- Check whether all stores have updated their promotions
- Replace incorrect or damaged materials
With centralized digital signage management, many content updates can be completed remotely.
This does not eliminate all on-site work. Screens still require installation, cleaning, inspection, and occasional maintenance.
However, reducing repetitive poster replacement and manual content distribution can lower operational workload.
C. Increase Promotional Flexibility and Campaign Efficiency
Retail promotions are often time-sensitive.
A traditional printed poster cannot easily respond to a sudden change in inventory, pricing, weather, customer demand, or promotional strategy.
Digital signage makes it easier to:
- Launch limited-time promotions
- Update prices and product information
- Schedule breakfast, lunch, and dinner campaigns
- Promote seasonal products
- Highlight new arrivals
- Coordinate promotions across multiple stores
This flexibility may help retailers respond faster to business opportunities and reduce the risk of displaying outdated information.
D. Create Additional Sales Opportunities
Digital signage can support sales growth by making products, offers, and promotions more visible at important points in the customer journey.
Examples include:
- Promoting high-margin products near checkout counters
- Highlighting seasonal products in store entrances
- Displaying complementary product recommendations
- Promoting bundle offers and limited-time discounts
- Using window displays to attract passing customers
- Showing digital menu promotions in restaurants and food service locations
Digital signage does not guarantee higher sales. Its impact depends on content quality, screen placement, audience exposure, product availability, pricing, and campaign execution.
Retailers should measure sales performance before and after campaigns, ideally using comparable stores or controlled tests.
3. Digital Signage ROI Calculator: The Basic Formula
To determine whether digital signage is worth the investment, retailers should calculate both the initial investment and the expected annual financial benefits.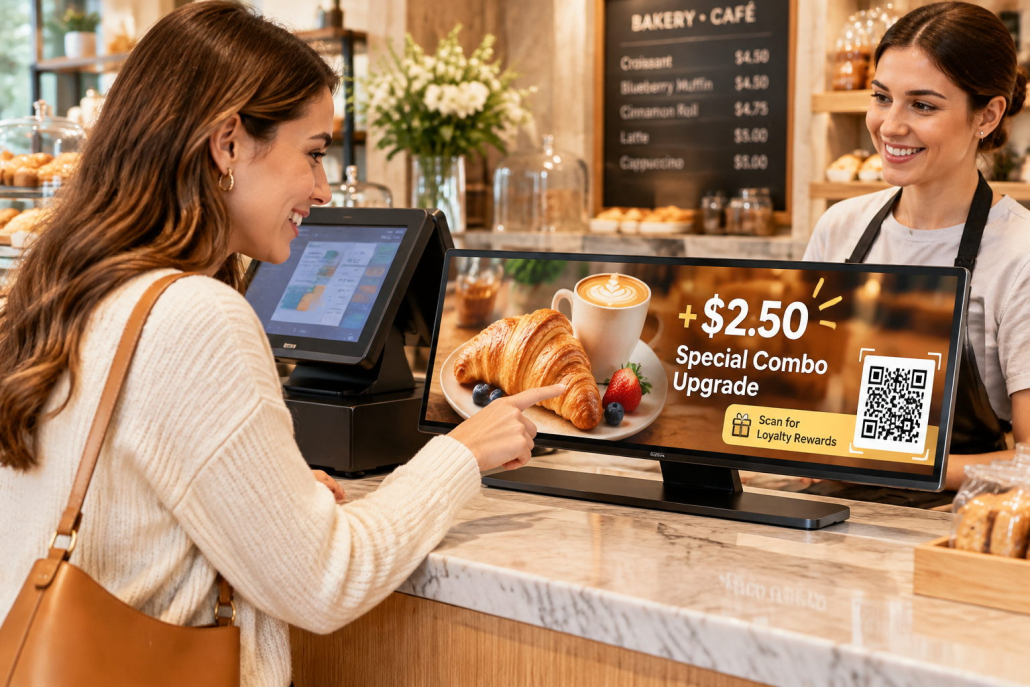
Step 1: Calculate the Initial Investment
The initial investment may include:
| Investment Item | Description |
|---|---|
| Digital Displays | Indoor signage, window displays, menu boards, or other commercial screens |
| Installation | Mounting, electrical work, network connections, and commissioning |
| CMS Software | Content management platform or software licensing |
| Content Creation | Initial advertising design and content production |
| Accessories | Mounting brackets, media players, cables, and other required equipment |
Initial Investment = Display Cost + Installation Cost + Software Setup + Initial Content Cost + Accessories
The calculation should reflect the actual project scope. Some systems include a built-in media player or CMS, while others require separate hardware or subscriptions.
Step 2: Calculate Annual Cost Savings
Use the following formula:
Annual Cost Savings = Printing Savings + Shipping Savings + Labor Savings + Other Avoided Costs
For a more detailed calculation:
- Printing Savings = Annual Printing Cost × Percentage of Printing Replaced
- Shipping Savings = Annual Promotional Material Shipping Cost × Percentage of Shipping Avoided
- Labor Savings = Annual Poster Replacement Hours Saved × Labor Cost per Hour
Only count costs that the business genuinely expects to avoid. Do not count the full printing budget as savings if some printed materials will still be required.
Step 3: Estimate Additional Gross Profit from Sales Growth
Digital signage may create additional sales opportunities, but it is important to calculate gross profit rather than treating all additional sales revenue as financial return.
Additional Gross Profit = Annual Sales Revenue × Attributable Sales Uplift × Gross Profit Margin
For example:
- Annual sales revenue: $2,000,000
- Estimated sales uplift attributable to digital signage: 1%
- Gross profit margin: 30%
Additional gross profit:
$2,000,000 × 1% × 30% = $6,000 per year
The 1% sales uplift in this example is an illustrative assumption, not a guaranteed result or an industry benchmark. Actual impact should be validated through store-level measurement.
Step 4: Calculate Annual Operating Costs
Digital signage also creates ongoing costs, which should be included in the ROI calculation.
These may include:
- Electricity consumption
- CMS subscription fees
- Internet or connectivity expenses
- Routine maintenance
- Replacement parts and repairs
- Content production and management
Annual Operating Cost = Energy Cost + Software Cost + Maintenance Cost + Other Recurring Costs
Step 5: Calculate Net Annual Financial Benefit
Net Annual Benefit = Annual Cost Savings + Additional Gross Profit − Annual Operating Costs
This figure represents the estimated annual financial benefit after accounting for recurring operating expenses.
Step 6: Calculate ROI and Payback Period
Annual ROI = (Net Annual Benefit ÷ Initial Investment) × 100%
Payback Period = Initial Investment ÷ Net Annual Benefit
If the net annual benefit is positive and remains relatively stable, the payback period estimates how long it may take to recover the initial investment.
For a multi-year project, retailers should also consider equipment replacement, software price changes, inflation, discount rates, and the time value of money.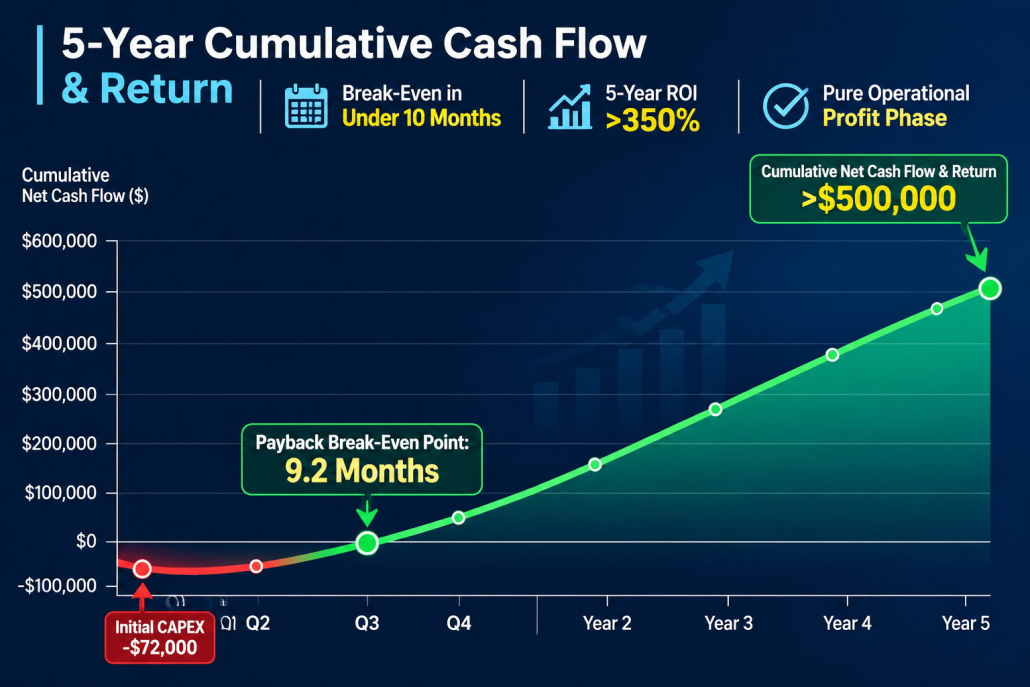
4. Digital Signage ROI Example: A Retail Chain with 10 Stores
Let’s consider a hypothetical retail chain planning to install digital signage across 10 stores.
The company currently relies on printed posters and promotional materials for regular marketing campaigns.
The following example uses illustrative figures to demonstrate how a buyer can prepare an investment evaluation.
Project Assumptions
| Item | Assumption |
|---|---|
| Number of Stores | 10 |
| Digital Displays per Store | 3 |
| Total Displays | 30 |
| Initial Display and Installation Investment | $30,000 |
| Initial Software and Content Setup | $2,000 |
| Total Initial Investment | $32,000 |
| Annual Printing Cost | $18,000 |
| Annual Shipping Cost | $2,000 |
| Annual Labor Cost for Poster Replacement | $6,000 |
| Printing Cost Replaced | 80% |
| Shipping Cost Avoided | 80% |
| Labor Cost Avoided | 70% |
| Annual Sales Revenue | $2,000,000 |
| Assumed Attributable Sales Uplift | 1% |
| Gross Profit Margin | 30% |
| Annual Electricity, Software, and Maintenance Costs | $5,000 |
A. Calculate Annual Cost Savings
Printing savings:
$18,000 × 80% = $14,400
Shipping savings:
$2,000 × 80% = $1,600
Labor savings:
$6,000 × 70% = $4,200
Total annual cost savings:
$14,400 + $1,600 + $4,200 = $20,200
B. Calculate Additional Gross Profit
Annual sales revenue:
$2,000,000
Assumed attributable sales uplift:
1%
Gross profit margin:
30%
Additional gross profit:
$2,000,000 × 1% × 30% = $6,000
C. Calculate Net Annual Benefit
Annual cost savings: $20,200
Additional gross profit: $6,000
Annual operating costs: $5,000
Net annual benefit:
$20,200 + $6,000 − $5,000 = $21,200
D. Calculate ROI and Payback Period
Initial investment: $32,000
Net annual benefit: $21,200
Annual ROI:
($21,200 ÷ $32,000) × 100% = 66.25%
Estimated payback period:
$32,000 ÷ $21,200 = 1.51 years
<Note: These are illustrative financial assumptions, not a Kontech customer case study or a promise of actual performance. The result will vary according to store operations, screen usage, installation costs, energy consumption, and measured sales impact. The annual ROI shown is a simple first-year net-benefit-to-initial-investment ratio, not an IRR or a multi-year investment return.>
This example demonstrates that digital signage can create financial value through a combination of reduced recurring marketing expenses and additional gross profit opportunities.
Importantly, even without any sales uplift, the example still generates annual net savings:
$20,200 − $5,000 = $15,200
This means the investment case does not have to rely entirely on an assumed increase in sales.
5. How to Use a Digital Signage ROI Calculator for Your Own Project
The example above can be adapted to your own retail business.
Before presenting a budget proposal, collect the following information:
Current promotional costs
- How much does the company spend on printing every year?
- How much is spent on shipping promotional materials?
- How many employee hours are used to replace posters?
- How frequently are promotional materials updated?
Digital signage investment
- How many stores need digital displays?
- How many screens are required per store?
- What screen sizes and brightness levels are needed?
- What are the installation and software costs?
- What are the expected electricity and maintenance costs?
Sales performance
- Which products or categories will be promoted?
- What is the current average sales revenue?
- What is the gross profit margin?
- How will the impact of digital promotions be measured?
A good ROI calculation should use actual company data wherever possible. If sales uplift is uncertain, calculate several scenarios rather than relying on one optimistic forecast.
6. Build Three ROI Scenarios Before Presenting Your Budget
Management teams are more likely to trust a proposal that acknowledges uncertainty.
Instead of presenting only one expected result, prepare three scenarios:
| Scenario | Cost Savings | Sales Impact | Purpose |
|---|---|---|---|
| Conservative | Based on verified avoidable expenses | No sales uplift assumed | Evaluate the investment’s cost-saving value |
| Expected | Based on realistic operational estimates | Modest, measurable uplift | Present the working business case |
| Optimistic | Higher adoption and operational efficiency | Stronger campaign performance | Understand potential upside |
For the sales impact, use controlled pilot results where available. If no reliable data exists, clearly label the figures as assumptions.
This approach helps management understand both the potential benefits and the financial risks.
7. How Digital Signage Can Improve Retail Sales Performance
Cost savings are often easier to quantify, but sales improvement can be an important additional benefit.
The following applications can help retailers use digital signage more effectively.
A. High-Brightness Window Displays: Attract Customers from Outside
<WindowDisplay>
Window-facing digital displays can present promotions, new arrivals, and brand campaigns to people passing by.
High-brightness screens are particularly useful in storefronts exposed to strong daylight, where ordinary displays may be difficult to see.
</WindowDisplay>
B. Indoor Digital Signage: Promote Products at Key Decision Points
<IndoorDisplay>
Indoor digital displays can highlight product benefits, limited-time offers, seasonal campaigns, and complementary products.
Strategic placement near entrances, product shelves, and checkout areas can increase the visibility of promotional messages.
</IndoorDisplay>
C. Digital Menu Boards: Support Promotions and Product Recommendations
<DigitalMenuBoard>
Restaurants and food retailers can use digital menu boards to display meal combinations, featured products, seasonal menus, and promotional offers.
Content can be scheduled for different meal periods and updated without reprinting physical menu boards.
</DigitalMenuBoard>
D. Multi-Store Content Management: Keep Promotions Consistent
A centralized CMS allows retail headquarters to coordinate campaigns across multiple stores.
This helps maintain consistent pricing, branding, and promotional information while reducing the workload associated with manual content distribution.
8. How to Present a Digital Signage Investment Proposal to Management
When requesting approval for a digital signage project, avoid focusing only on screen specifications, resolution, or equipment appearance.
Management teams are generally more interested in business outcomes.
A convincing proposal should include five parts:
1. Current Business Problem
Explain the current cost of printed advertising, the frequency of campaign updates, the labor involved, and any difficulties maintaining consistent promotional information.
2. Proposed Digital Signage Solution
Specify the number of stores, display quantities, screen types, installation locations, CMS requirements, and implementation schedule.
3. Financial Analysis
Present:
- Total initial investment
- Annual printing and labor cost savings
- Estimated additional gross profit, if supported by evidence
- Annual operating costs
- Net annual benefit
- ROI and payback period
4. Pilot Project and Measurement Plan
Consider testing the solution in a small number of stores before a full rollout.
Measure:
- Printing expenses before and after implementation
- Labor hours spent on promotional updates
- Campaign execution time
- Sales performance of promoted products
- Screen uptime and maintenance expenses
Where possible, compare pilot stores with similar stores that have not yet adopted digital signage.
5. Rollout and Risk Management
Include installation planning, staff training, content management responsibilities, maintenance arrangements, warranty coverage, and spare-parts planning.
This makes the proposal more practical and easier for management to evaluate.
9. How to Choose the Right Digital Signage Displays for Better ROI
The financial performance of a digital signage project depends partly on selecting the right display for each application.
Choosing a screen with unsuitable brightness, size, or environmental protection can lead to poor visibility, unnecessary expenses, or premature replacement.
Consider the following:
| Retail Application | Recommended Display Type | Key Considerations |
|---|---|---|
| Storefront Windows | High-Brightness Window Display | Daylight visibility, screen brightness, slim design |
| Indoor Promotions | Indoor Digital Signage | Image quality, installation flexibility, content management |
| Shopping Malls | Commercial Digital Displays | Operating stability, centralized management |
| Restaurant Menus | Digital Menu Boards | Readability, scheduling, multi-screen content |
| Outdoor Advertising | Outdoor Digital Signage | Weather protection, thermal management, brightness |
For retail chains and commercial projects, also consider product consistency, OEM/ODM customization, long-term parts availability, and manufacturer support.
A display should be selected according to its actual installation environment and operating requirements—not simply the lowest purchase price.
Looking for Cost-Effective Digital Signage Solutions for Your Retail Business?
Kontech specializes in commercial display solutions, including high-brightness window displays, indoor digital signage, outdoor digital signage, and digital menu boards.
As a commercial display manufacturer, Kontech provides B2B customers with OEM/ODM customization and display solutions for retail stores, restaurant chains, shopping malls, and commercial projects.
Whether you are planning a pilot installation or a multi-store rollout, our team can help you evaluate suitable display configurations based on your application, screen requirements, and project budget.
Digital Signage ROI Calculator
Calculate your potential savings, additional gross profit, annual ROI and investment payback period for a retail digital signage project.
1. Project Information
2. Current Annual Promotional Costs
3. Estimated Cost Reduction
4. Investment & Sales Assumptions
5. Your Estimated ROI Results
Annual Financial Breakdown
Calculation: Annual cost savings + additional gross profit − annual operating costs. Simple annual ROI = net annual benefit ÷ initial investment × 100%. Payback period = initial investment ÷ net annual benefit. These are estimates, not guaranteed financial results. Actual performance depends on project costs, store operations and measured sales impact.

